home world map statistics data documentation project vraoum v1.5-test
Vraoum project documentation for version v1.5-test
The vraoum project aims to provide historical aircraft statistics and visualisation, accessible on https://vraoum.ydns.eu.
The website is structured as follows:
world map
A map of aircraft trajectories for one week, with time control and colored by altitudestatistics
Localized statistics of aircraft flybys over specific areas of interest, showing altitude and data of the aircrafts and their owners
Comparative statistic accross different regions of interestdata
Processed data download (work in progress)documentation
Documentation of the project
Documentation chapters:
Overview
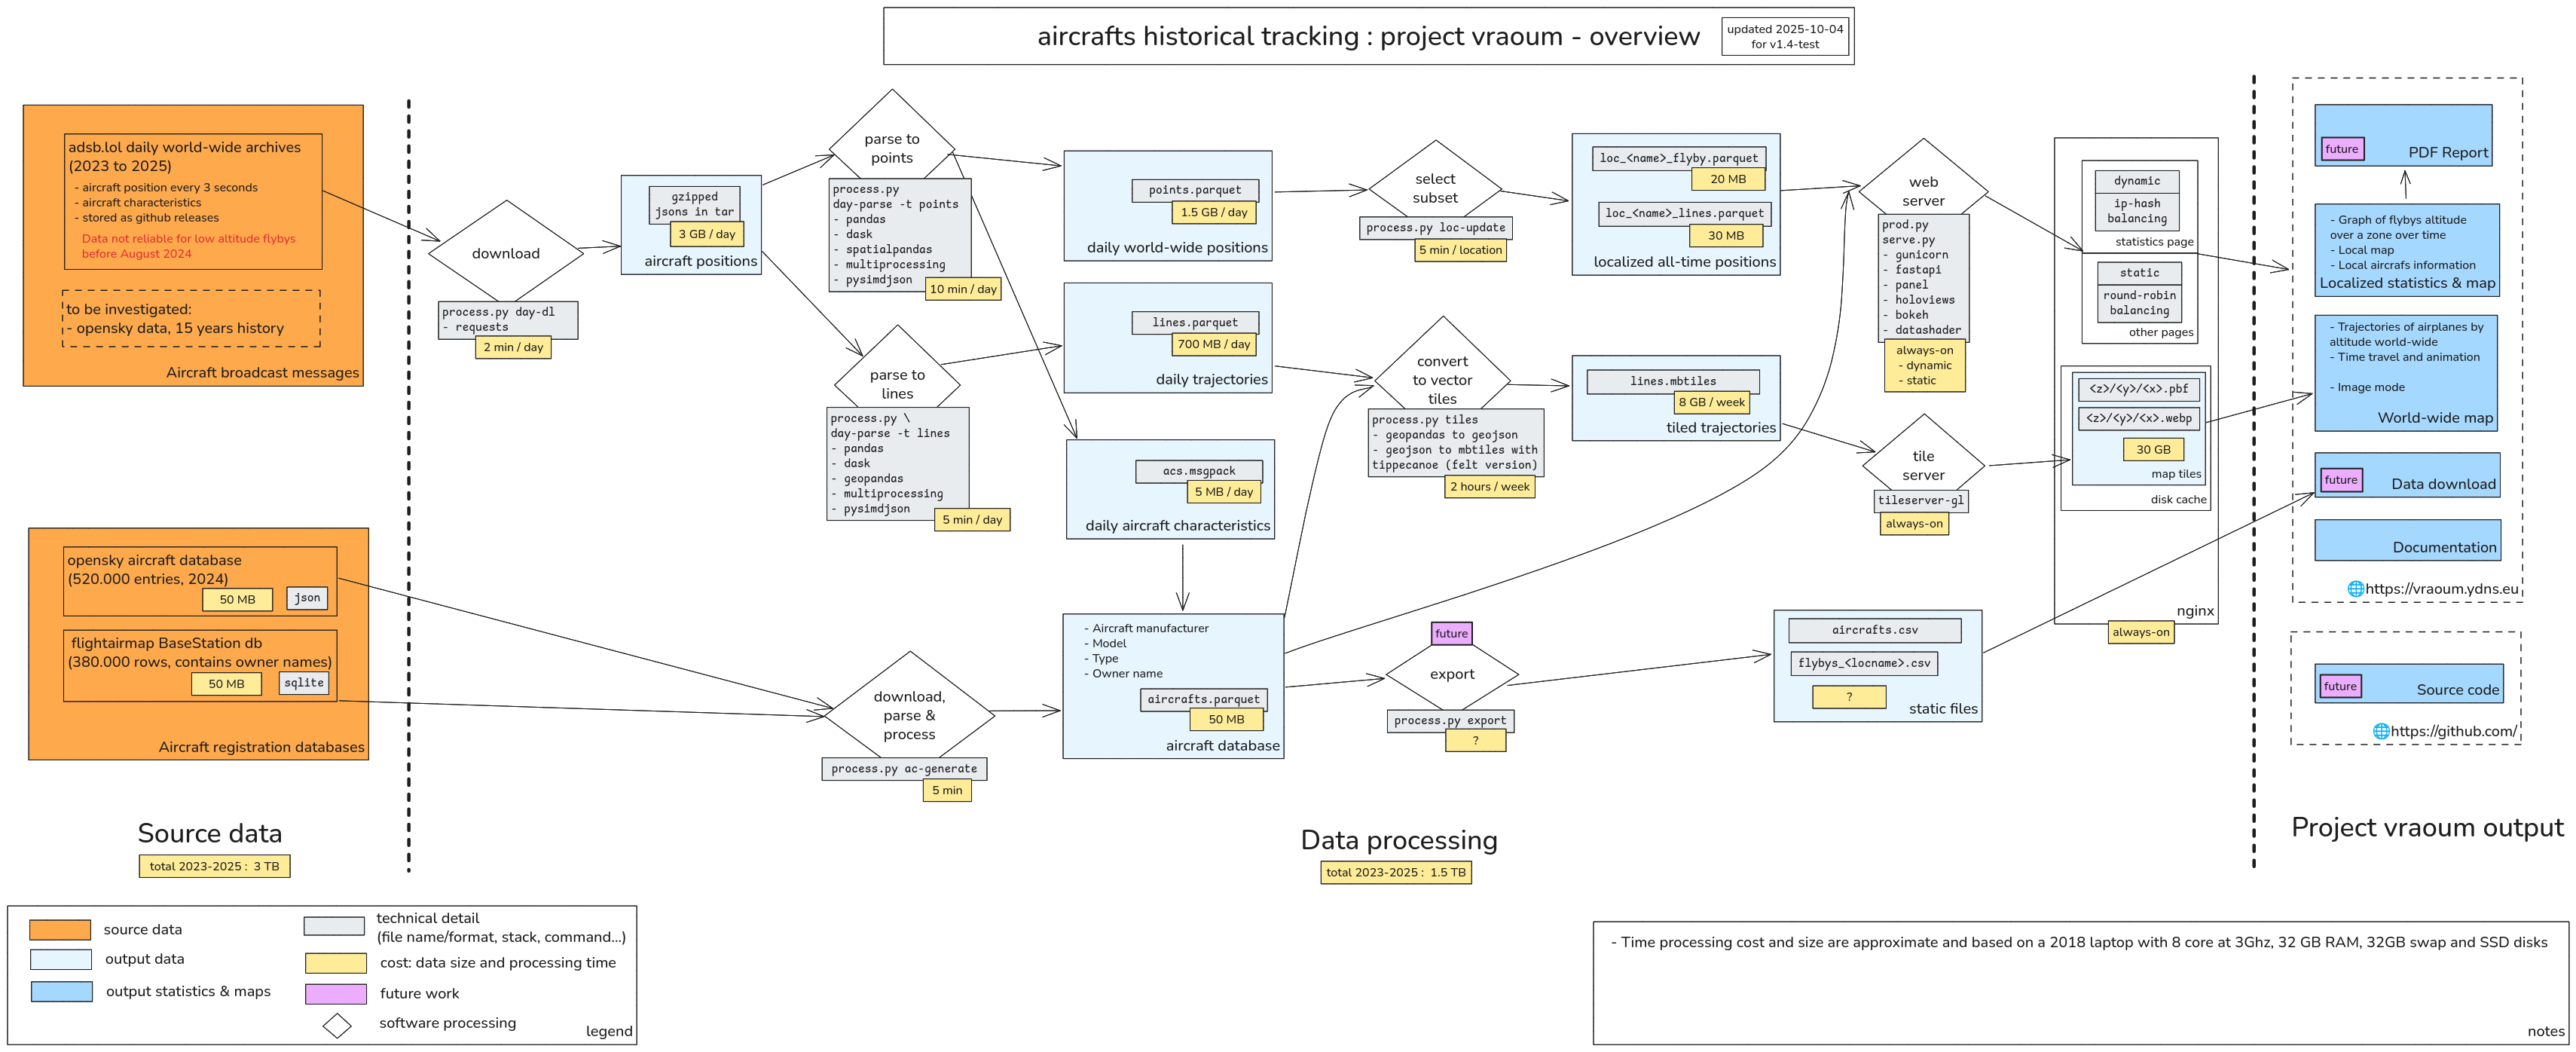
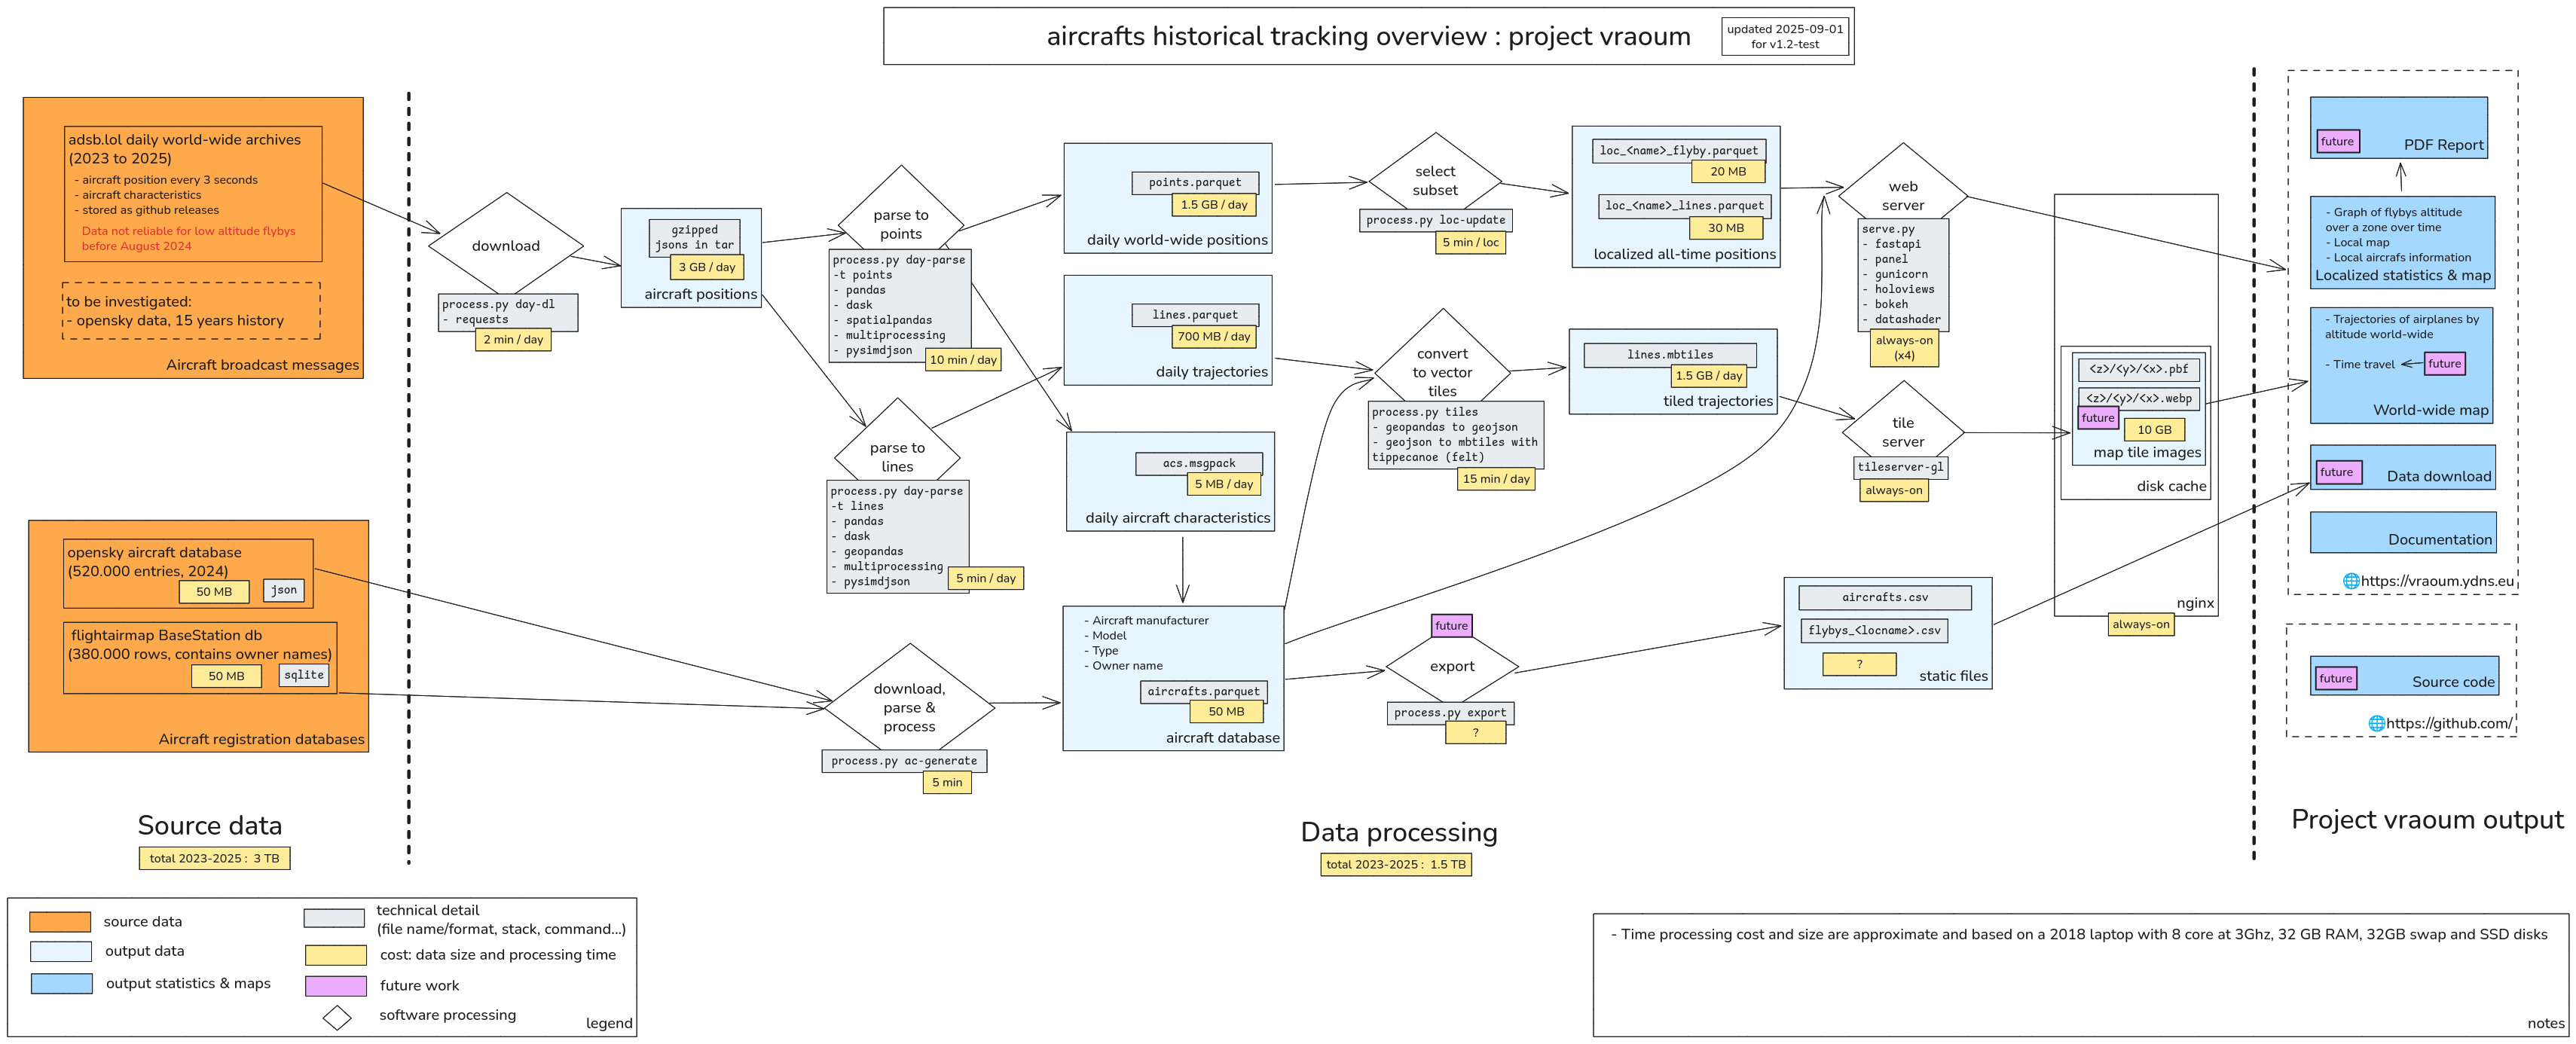
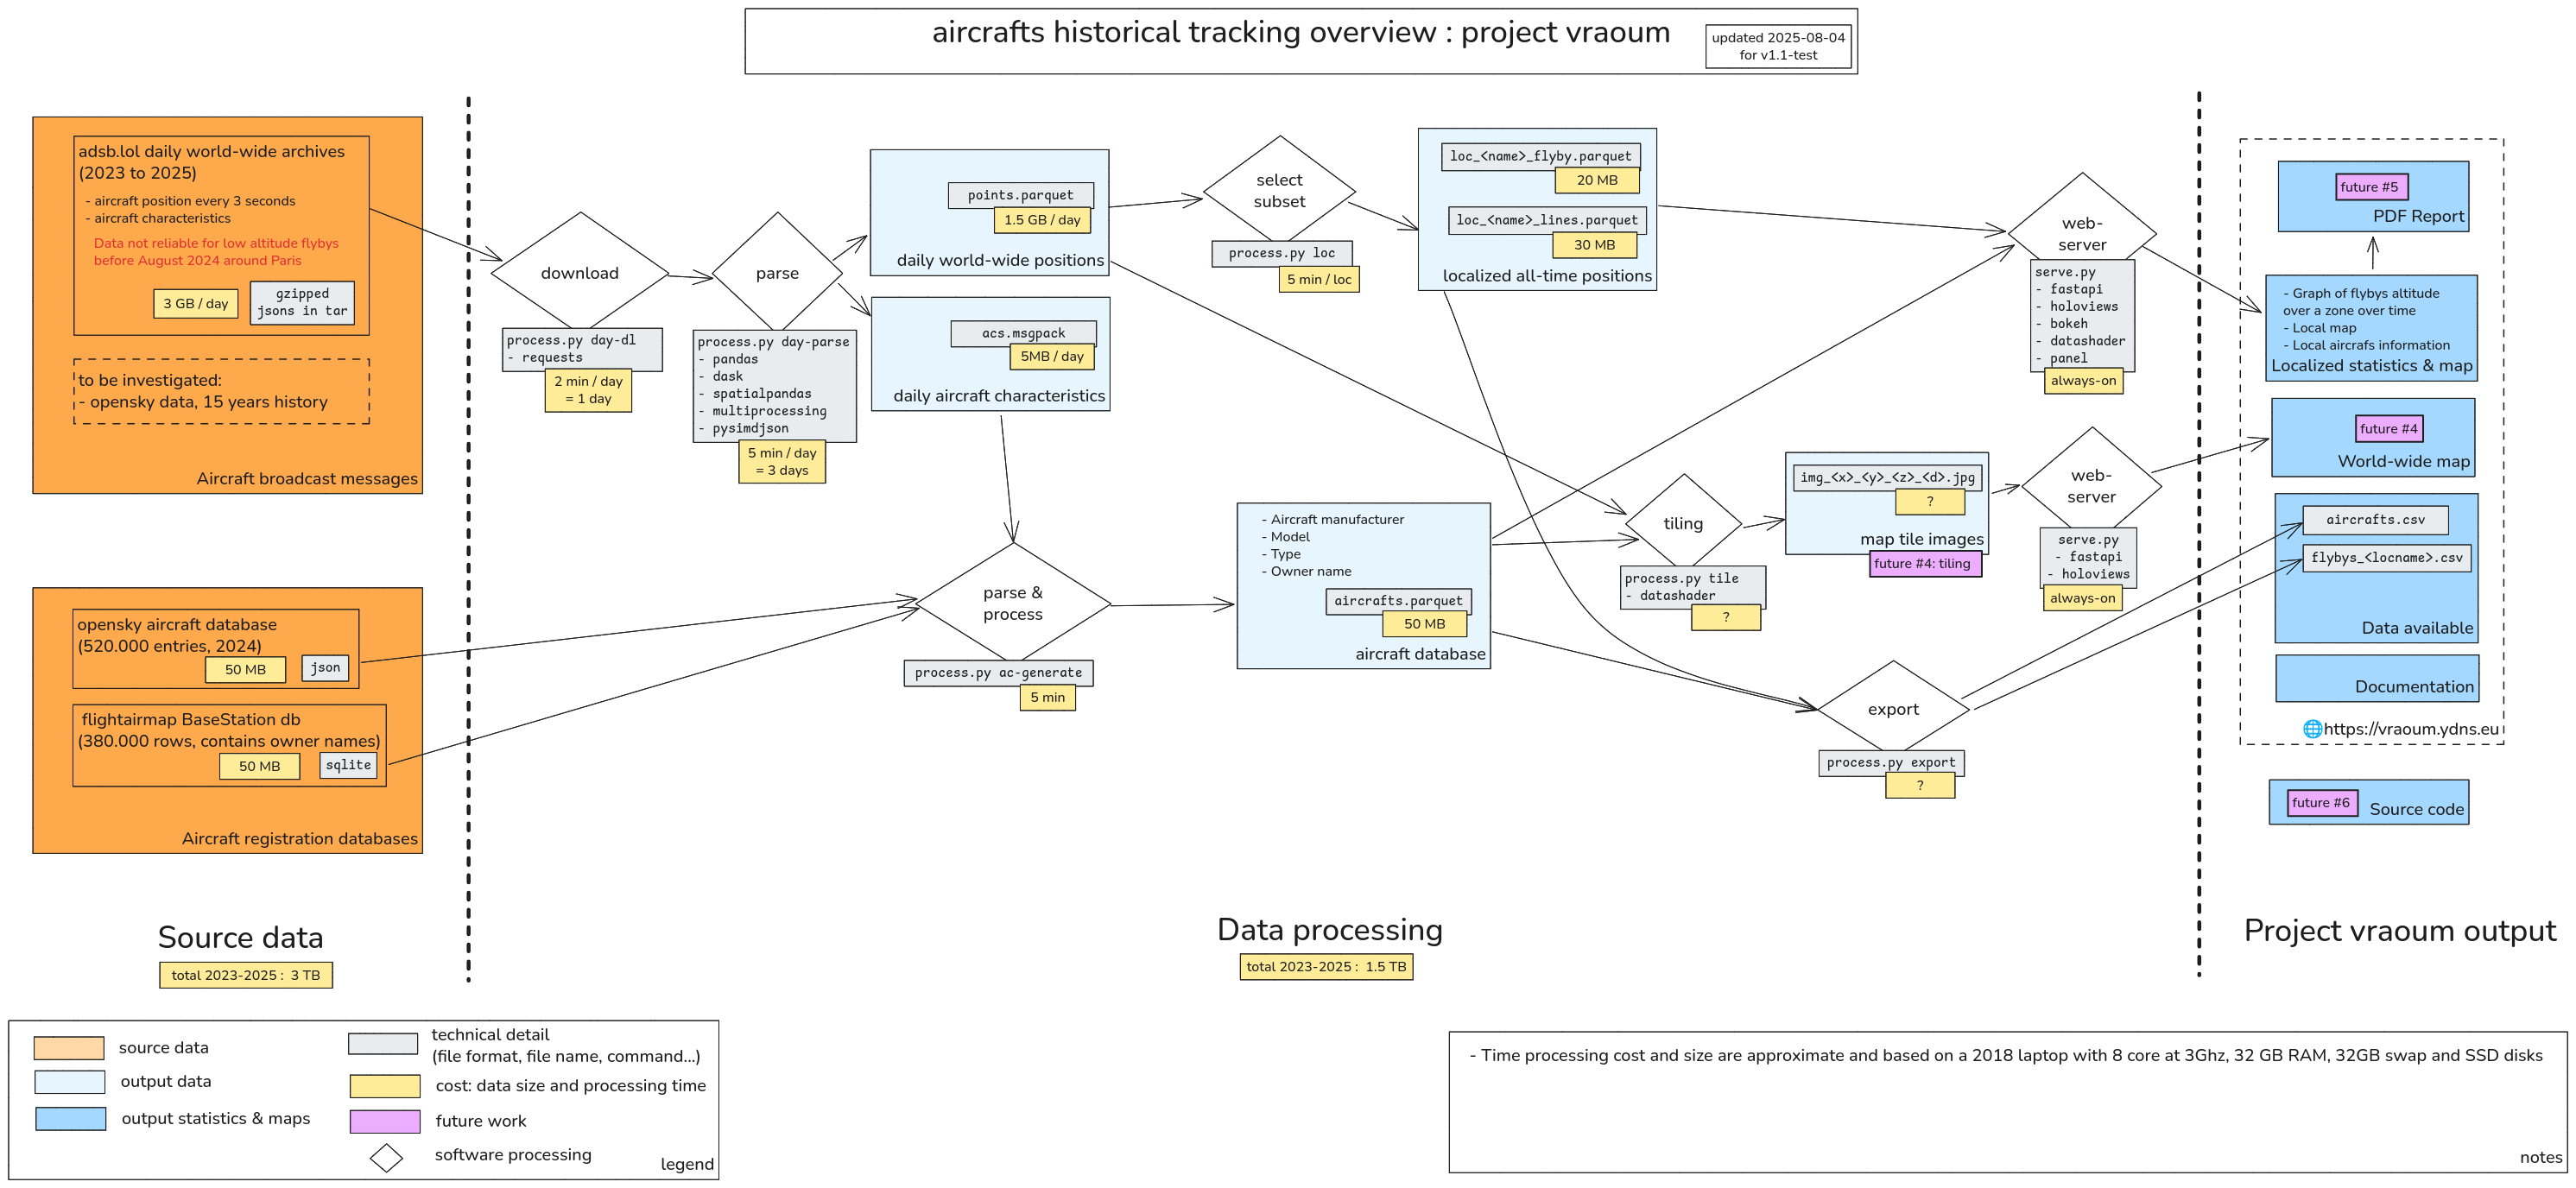
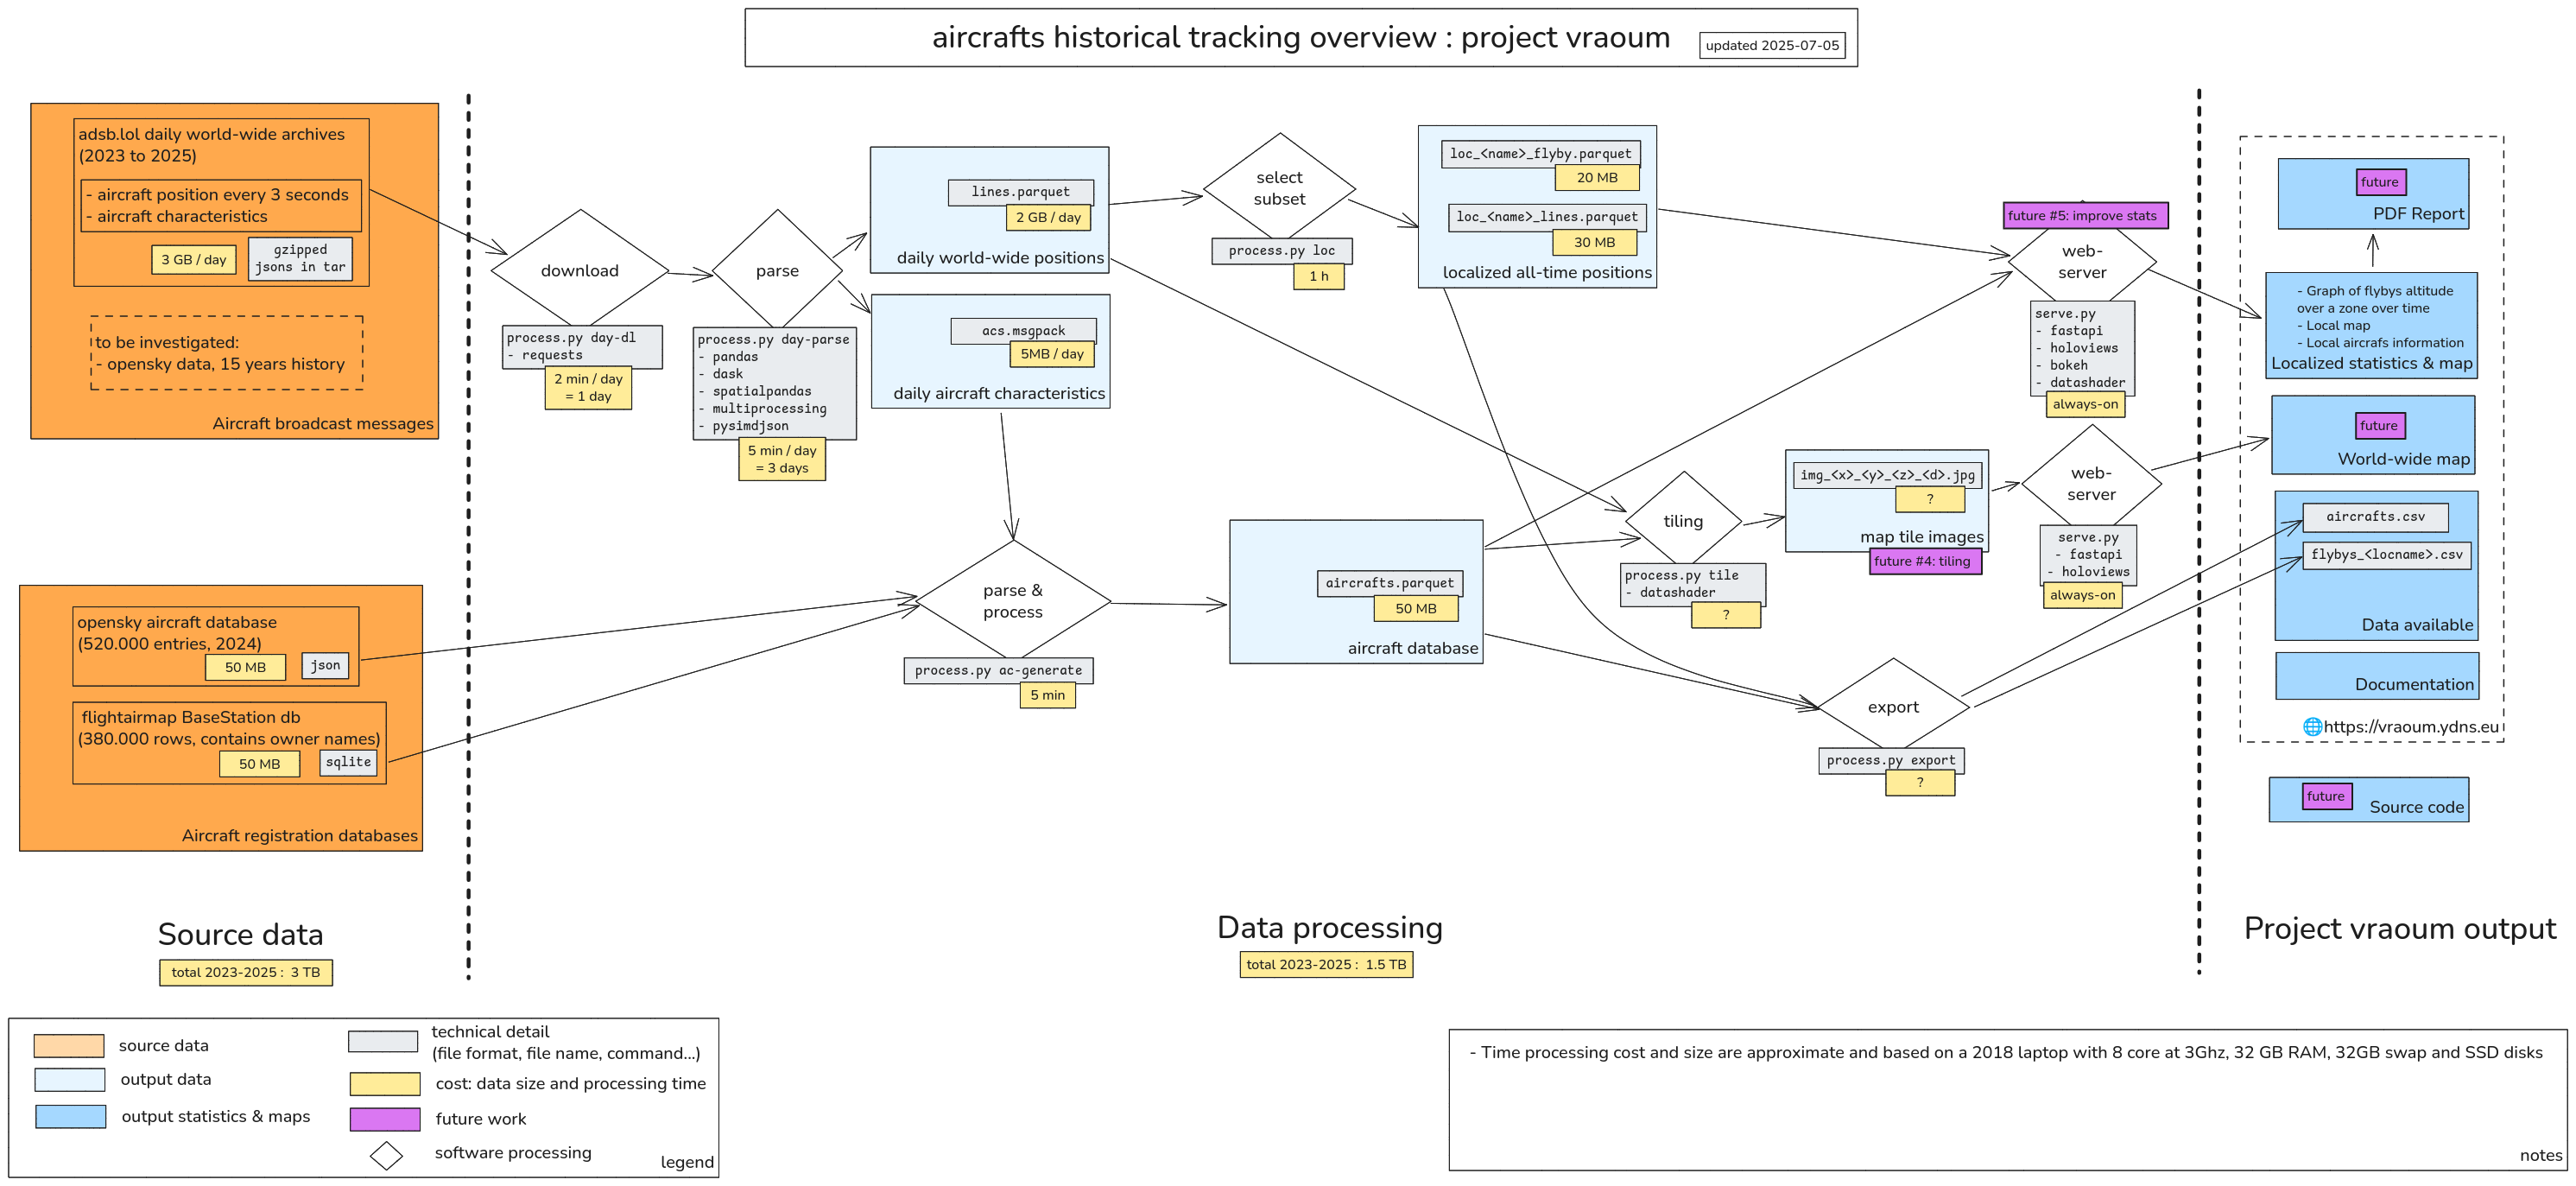
The vraoum project is based on multiple data sources for aircraft location and categorisation, as well as open-source tools for processing this data.
The schematic bellow summarizes the different sources and output of the vroum project:
- on the left side, the data sources in orange.
- on the right side, the project output in blue, mainly what is available on the website.
- in the middle, the various processing steps and intermediate data generated
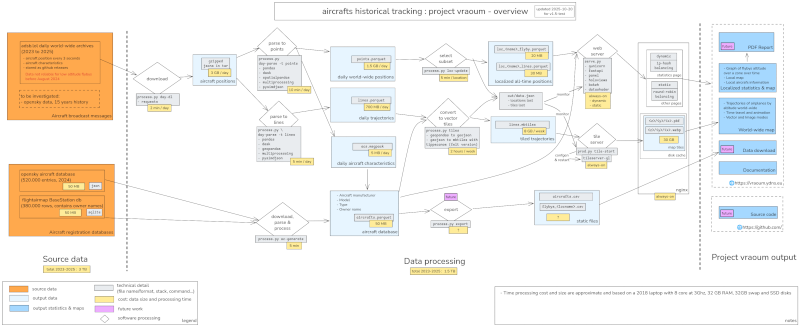
(click to enlarge)
See the how it works section for more details on the data sources and analysis software we use.
Website usage
This section provides help on how to use the website https://vraoum.ydns.eu.
World map
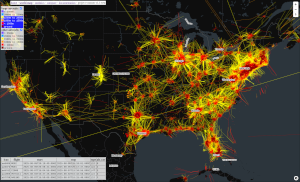
The worldmap displays worldwide flight for a period of one week, colored by altitude, with a timeline to control which week is displayed.
On the top left you have 5 types of controls:
- base map selection : dark (default), light or colored
- label mode: above aircrafts (default), bellow aircrafts or hidden
- image or vector switch:
- image mode: default mode, faster for slow devices. also known as raster mode
- vector mode: enables display of individual flights information on mouse-over, as well as individual aircraft altitude layer selection
- opacity slider to change the aircrafts layers opacity
- in image mode, it will change the contrast
- in vector mode, it will change the actual line opacity
- layer toggles:
- in image mode, you can only select to display large aircraft, other aircraft or both
- in vector mode, you additionally can control which flight altitudes layers are visible for large and other aircrafts.
large aircrafts and other aircrafts. See aircraft types for more information.
On the bottom left you can see 2 different parts:
- flights list under your mouse pointer (only in image mode)
You can click on the icao number to open aircraft information from planespotters.
You can click on the flight number to open flight information from flightaware.
If you click on the map, it will freeze this list. Click again on the map to unfreeze.
- a timeline where your can select the displayed week with the slider
Then 2 left and right buttons allow to quicly switch to previous and next week.
Then a play / stop button controls the automatic change of weeks every 1 second (+ loading time).
The compare button allows to quickly switch between 2 selected weeks.
On the bottom right, click on the icon to enter and exit fullscreen mode.
Statistics pages
Once you select a location on the statistics index page, you have access to the flyby statistics of that location, described below.
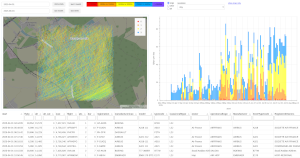
The statistics page for a specific location show 4 main parts:
- on top, the controls
- on the left, a map of the location
- on the right, a bar chart of aircraft flyby altitudes over time
- at the bottom, a data table showing detailed aircraft information for each flyby
The controls
From left to right:
- date start
- date end
- shortcuts to 4 start dates
(all, last 3 month, last month, last week)
- altitudes categories
Each has a color matching the color on the map and the bar chart.
You can click on each altitude category to select or unselect it.
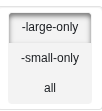
- plane types
(large, other, all)
the type of airplanes to view, see aircraft types
- resolution
It affects the bar chart.
- a link a "map only" view
To get the map in fullscreen
The map
The map displays all aircraft trajectories over the location area, colored by altitude.
Airports are also shown on the map as follows:
- while circle: large airport
- white triangle: small and medium airport
- while diamond: heliport and balloonport
- white cross: closed airport
To zoom on the map, use the mouse wheel.
The bar chart
To zoom on the chart, use the mouse wheel.
To move the chart left and right, drag it with left click.
The data table
You can order a column by clicking on the column title.
You can filter each column criteria by entering a specific value in the text area in the column title.
Aircraft types
One way to categorize aircrafts is through a 3-symbol code, the Aircraft Type Description from ICAO Doc 8643 (old version) and summarized on skybrary.
We have this information for almost every aircraft through aircraft databases source data.
In the vraoum project, we consider the following to be large aircrafts:
- L2J, L4J, L8J : a landplane with 2, 4 or 8 (?!) jet engines
- L4T, L8T : a landplane with 4 or 8 turboprop/turboshaft engines
Other types are considered small aircrafts.
Statistics compare page
From the statistics index page, click on compare statistics between locations.
The compare page shows the number of daily flybys on 5 different charts representing different altitudes.
Each chart contains statistics for several location, allowing comparison.
The values are aggregated to a per-week resolution to make the plot smoother.
To zoom on the chart, use the mouse wheel.
To move the chart left and right, drag it with left click.
On the left you can select the type of airplanes to view, see aircraft types.
Data page
This page allows to download data generated as part of the vraoum project:
- aircrafts database (aggregated from opensky [1], flightairmap and collected ADSB messages) [csv]
- aircrafts flybys over selected locations (accross all time) [csv]
It is not yet available.
How it works
How does the vraoum project works internally: What source data do we use, what software do we use.
See also the overview section for a summary and schematic view of the project.
Source data
We summarize here the various data sources that can provide aircrafts position history.
The entries highlighted in bold indicates the data source is actually used in the vraoum project.
- historical flight data :
 adsb.lol releases (2025, 2024)
- Great openly licensed aircraft broadcast data updated daily through github releases, providing good coverage mainly for US and Europe, with 1 year or so history (before September 2024 data is more sparse)
- Contain world-wide aircrafts position and some emitter characteristics every 3 seconds saved to daily archives. These informations are gathered from Mode-S and ADS-B messages sent by aircrafts and received by a network of ground antennas.
- Missing data for low flyby altitudes in many locations, especially before September 2024
- format: readsb globe trace-jsons
- to be investigated in future
- aircraft database
 opensky aircraft database [1] (csv, 2024, 520,000 rows)
 flightairmap - Data - BaseStation db (sqlite gzipped, 380,000 rows, contains owner names)
- per country
- index of countries and associated websites
- France immatriculations
- FAA aircraft registration database
- airports list
- world cities
- GADM data - GADM wants to map the administrative areas of all countries, at all levels of sub-division
- airline flight routes
Data analysis software
Custom software has been written for the vraoum project. This software will be released as open-source in the future.
It is based on open-source software libraries specialized in importing data, processing data and visualizing data.
We used python and javascript programming languages.
Bellow is a list of software that have been evaluated for use in the aircraft data import, processing and visualisation.
The entries highlighted in bold indicates the software is actually used in the vraoum project.
This list also contains links to interesting official documentation (doc) and example usecase (ex).
python without external database
- data import
pysimdjson for importing the source CSV data
- data storage and processing
pandas for data analysis
dask to allow multi-core and multi-host pandas processingparquet file format for storage of the processed dataspatialpandas to store points
geopandas to store lines
polars dataframes
- faster, but not compatible with holoviews / datashader framework
- doc: getting started
- statistics and visualisation:
holoviz ecosystem (see also holoviz cheatsheet)
holoviews for visualisation abstractions
datashader for visualisation rendering
bokeh for web-browser viewing directly from python
- world map / tiling (see also Displaying a world map)
- tiling: server-side
- render with datashader
- serve tiles
- generate vector tile files from pandas dataframes
- export GeosJSON from geopandas
- geopandas issue#2295 ENH: functionality which saves vector dataset to mbtiles directly
- works through gdal: a translator library for raster and vector geospatial data formats
- and through pyogrio: bulk-oriented spatial vector file I/O using GDAL/OGR
gdf.to_file("nybb.mbtiles", driver="MBTiles", minzoom=1, maxzoom=3)
- convert GeoJSON to mbtiles
- tile servers
- tileserver-gl based on MapLibre GL Native (raster & vector)
well maitained, ability to rasterize vector tiles
- titiler Build your own Raster dynamic map tile services
- mbtileserver Basic Go server for mbtiles (raster & vector)
- martin Blazing fast and lightweight PostGIS, MBtiles and PMtiles tile server, tile generation, and mbtiles tooling (vector only)
- caching server
- utilities
- rasterioxyz tiling georeferenced Rasterio DatasetReader objects according to the XYZ tiles standard
- mercantile Spherical mercator tile and coordinate utilities
- vector tiles ressources
- vector map editor
- maputnik An open source visual editor for the 'MapLibre Style Specification'
- tiling: client-side
- MapLibreGL JS for world map
- leafmap interactive mapping with MapLibre and kepler.gl backends
- python bindings for MapLibreGL
- leafmap backend uses py-maplibregl
- they are maybe too much oriented towards live python apps (the Solara stuff)
- limitations when you want to extend functionalities, compared to full javascript
- py-maplibregl - python bindings
- python bindings for MapLibreGL
- quite limited functions
- folium for world map
- visualize raster tiles generated previously with
datashader
- based on leaflet
- cons: raster only
- deck.gl
- rendering of
MVTLayer slows down the UI navigation, so it ends up being much slower than mapbox-gl to render lots of lines (2025-08)
- doc: gallery
- pydeck (based on deck.gl)
- sounds promising, but sluggish UI on heavy rendering as per deck.gl
- kepler.gl client-side geospatial analysis tool for large-scale data sets.
uses MapLibreGL for handling tiles
- web server
FastAPI to generate content and serve holoviews applicationsgunicorn for multi-process backend
python with external database
- Apache
Sedona + pyspark
- does not allow easy interface with powerful visualation tools
- javascript with Mosaic
R
Julia
- apparently faster than python stuff for data processing, but less options for visualisation and need to learn new language
Issues encountered
Bellow are some issues encountered during development, to be kept in mind when working on similar projects.
Data size : Plan ahead
- You should plan where you want to store the full dataset right at the start, and whether you need to split it accross multiple storage devices, in order to avoid copy data around afterwards, which will waste your time.
Large data processing : Start simple
objective: Showing flight path on a map from points
- At first, parsing was storing each aircraft location point as a line segments (current and previous point) so they can be immediatly drawn as a path
- It led to processing slow-downs compared to simple points
- Re-processing of the whole dataset as points instead of lines was performed, a waste of time.
Displaying a world map
Tiling or not tiling ?
Tiling: vector or raster ?
Raster tiles storage takes a lot of space, and high level of zooms are very often unused (see OSM wiki: tile disk usage).
Try pre-generate first zoom levels, and on-demand with caching for high zooms.
Similar projects
Project history
- 2025-10-30
v1.5-test : Improve overall robustness and automation of data updates
- add a health page
- add freshness stats data check
- infrastructure harmonisation between backend machines
- map: don't show tiles that are not validated (out/data.json)
- dead code cleanup, move some to research/
- stats: implement auto-reload
- tiles: auto-reload on update, doing tile confgen and restart server
- tiles & map: generate per week number
- storage: organise workdir by year, so we can easily store each year in different disk
- stats & map: improve daily-update
- map: crank up workers count and parallel requests
- minor bug fixes and improvements
- 2025-10-04
v1.4-test : Introduce map play button and improved controls, fix smartphone support
- improve navigation bar appearance
- map: add animation play button
- map: fix time control lagging behind in image mode, by locking it when loading
- map: new time control arrows
- map: add loading indicator at bottom left
- map: improve tiling display
- map: bump maplibre-gl-js versions
- map: fix opacity setting
- map: improve smartphone / tablet support
- statistics: add Amsterdam and Nantes
- processing: introduce separate out/ directory for data used by the servers
- processing: improve tiles pre-caching
- minor bug fixes and improvements
- 2025-09-15
v1.3-test : World map timeline, flight mouseover, image mode (default). Improve infrastructure to handle some load.
- 2025-09-01
v1.2-test : Add world map and associated lines and tiles generation. Automate daily update process.
- 2025-08-04
v1.1-test : Add map and data table for localized statistics, add a compare page
- 2025-07-05
v1.0-test : First partial test release for external reviews. Only localized statistics are available. Missing maps and PDF export and possibly many other things. No source code release yet.
- 2025-06-20 : Started working on the project
- 2025 : Started thinking about the project
roadmap
References
ref-1 OpenSky
Bringing up OpenSky: A large-scale ADS-B sensor network for research
Matthias Schäfer, Martin Strohmeier, Vincent Lenders, Ivan Martinovic, Matthias Wilhelm
ACM/IEEE International Conference on Information Processing in Sensor Networks, April 2014
The OpenSky Network, http://www.opensky-network.org
Laurent Ghigonis <laurent.ghigonis -at- gmail.com>
github
 OurAirports - airports database (csv, 2025, 83,000 rows)
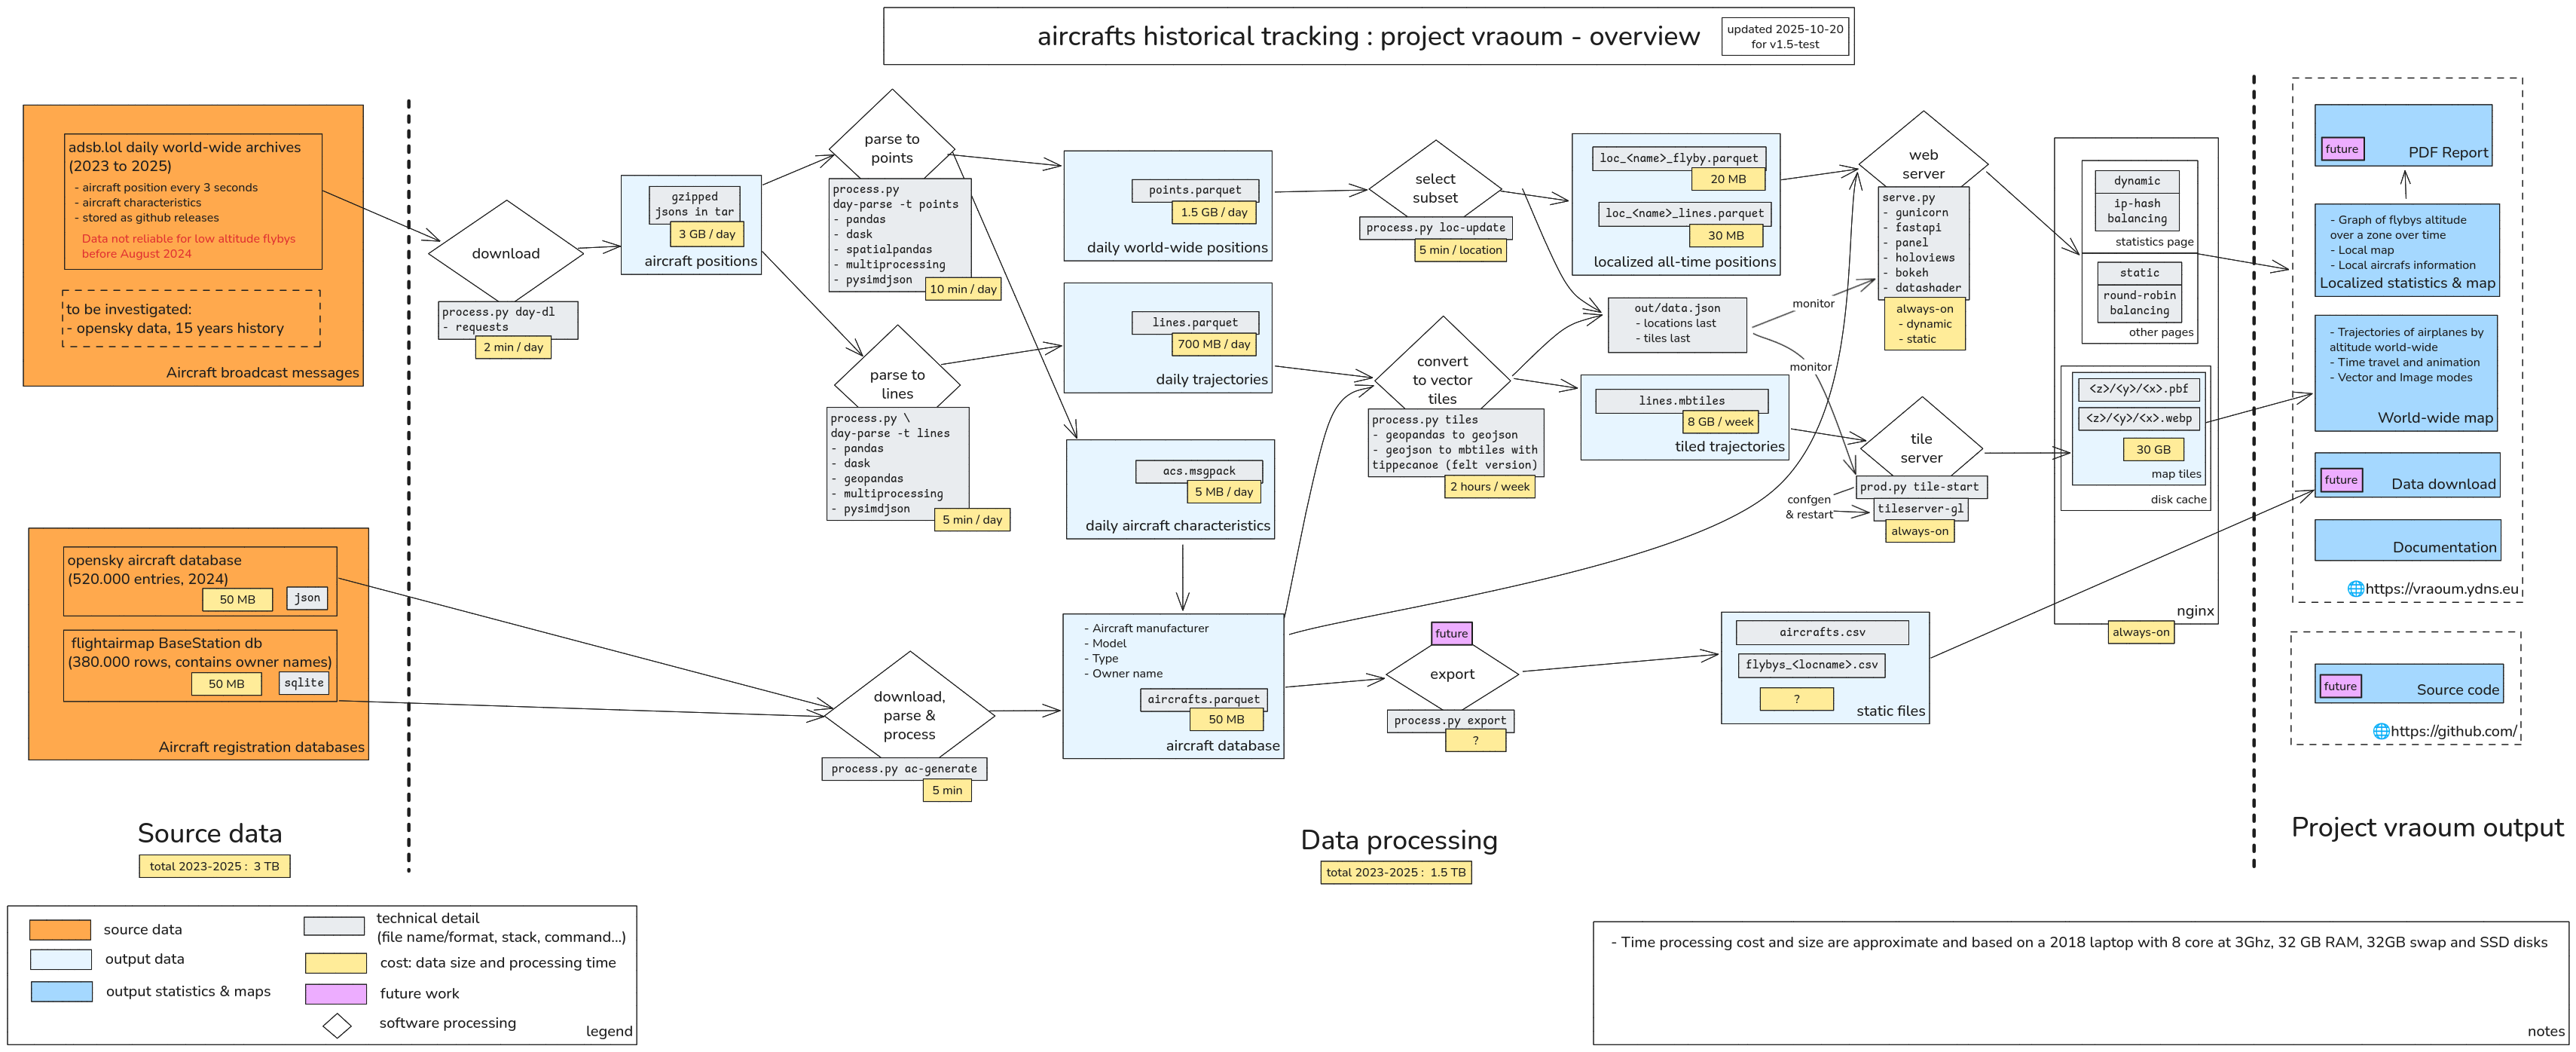